Just a 2 weeks back, Bank of Japan (BOJ) announced negative interest rates that made USDJPY shoot up massively. You can read this post where I provide the details on what happened when BOJ announced negative interest rates. But those high levels made by USDJPY were not sustainable. It was fell down after a few days a massive 1200 pips. Of course not in a day but over the next 10 days. Take a look at the following screenshot.
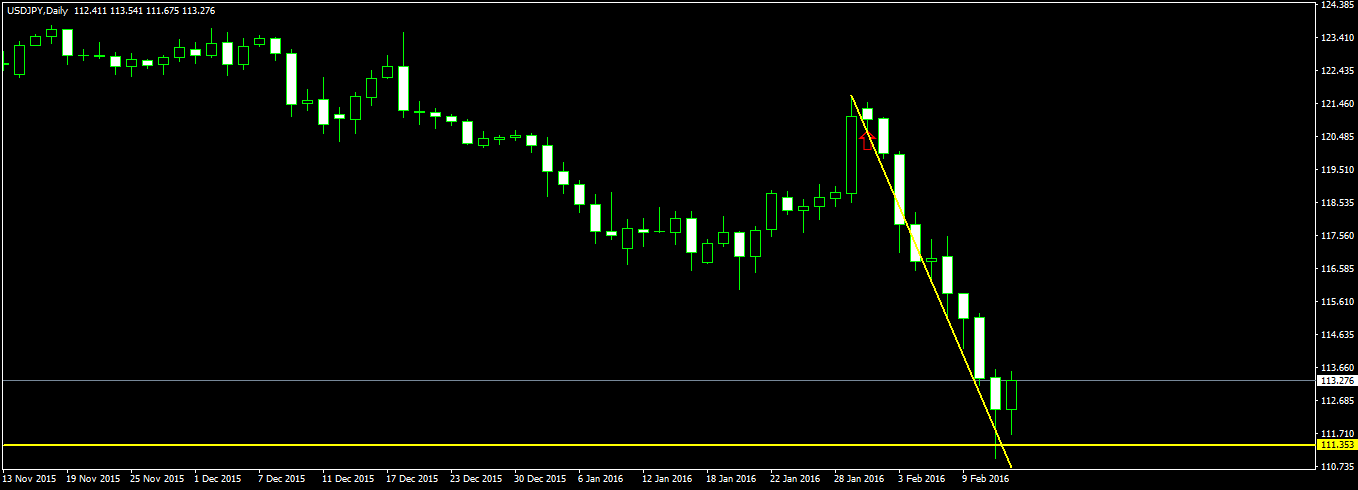
In the above screenshot of USDJPY daily chart, you can see USDJPY making massive bearish long white candles. Just above red arrow you can see an inside bar. When an inside bar forms on the daily timeframe or the weekly timeframe just take it as a strong signal that trend is going to reverse soon. Now if you are not sure how to trade with Inside Bars, you should watch these Inside Bar Trading Strategy videos before you proceed further. How do we know when is the right time to make an entry? For that we use the 4 hour chart. Take a look at the following screenshot.
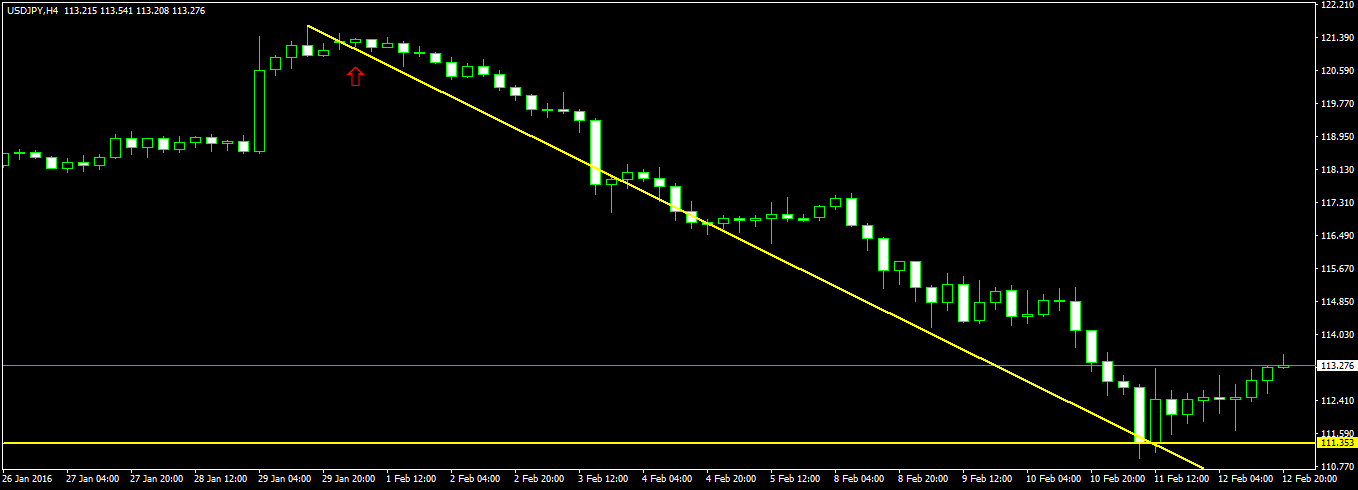
In the above screenshot just above the red arrow, we find the candles signalling that price is about to fall massively as you can see many H4 candles that are not going up which is a strong indication that price is finding resistance at this price level to go up. So we make an entry at 121.280 with one standard lot and place the stop loss at 121.700. The risk is 42 pips. In dollar terms this comes out to be $420. If you have $10K in your account this means a risk of 4.2%. After second day we move the stop loss to breakeven and from now onwards our trade is RISK FREE.
Now we don’t know how much USDJPY will fall. There is no way to predict that. So we keep the trade open and daily look for a trend reversal signal on H4. If there is no trend reversal signal we keep the trade open. USDJPY keeps on falling. Since we have made our trade RISK FREE, we are not afraid of losing. After USDJPY has fallen 1000 pips, we close the trade.
If you look at the daily chart above, you can see massive bearish white candles which just means that price is going to fall more. The last daily candle is bullish and is an inside bar which is an indication that USDJPY downtrend is over now. So we closed the trade with a profit of 1000 pips.
In the above post you can see the first thing that we focused on was the risk of the trade. We tried to enter with a small risk of 42 pips. Then on the first opportunity we made the trade risk free by moving the stop loss to breakeven. After that it is just a matter of watching the charts daily at the close of the daily candle and determining whether you want to continue in the trade or close it. When the daily candle is bearish, we continue with the trade. When we find a bullish candle that is an inside bar, we close the trade and take profit. Our profit was 1000 pips.