GBP/USD pair formed an ascending triangle pattern on the 1 hour chart on 12th June. Normally an ascending triangle when it forms in an uptrend is viewed as a continuation pattern. But in this case if you take a closer look below a bearish engulfing pattern is being formed right at the trendline break. Can this mean the start of a downtrend? Since the triangle pattern is mostly a continuation pattern meaning the uptrend will continue, the downtrend can be short retracement before the price action reverses and starts the uptrend again on the H1 timeframe. An uptrend on H1 timeframe for GBP/USD pair can easily give you 100 pips. Similarly a downtrend on the H1 timeframe for GBP/USD can also make you 100 pips if you can predict it in time.
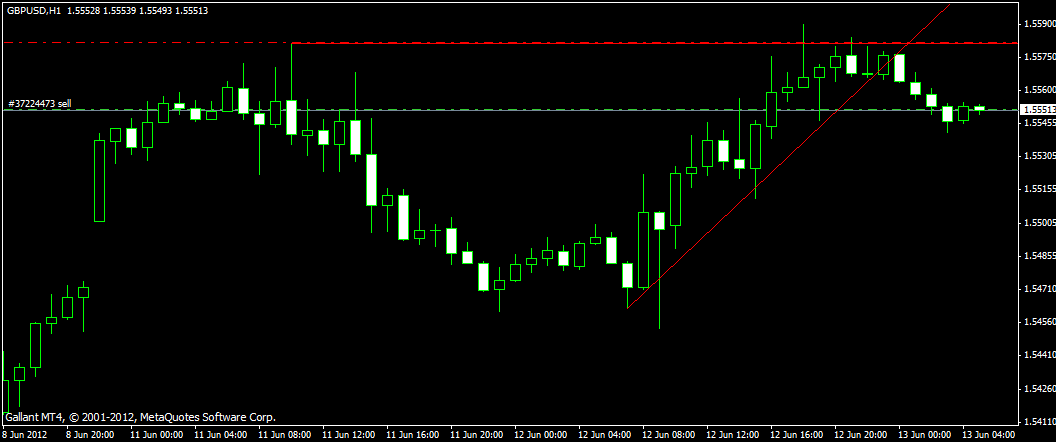
Trading is an art as well as a science. If you take a closer look at the above GBP/USD chart on H1 timeframe, you will see a horizontal upper trendline and an ascending lower trendline forming a nice triangle pattern. The horizontal upper trendline acts as a resistance while the ascending lower trendline acts as a support. But there is something else on this chart.
The first observation that you must take notice of is the gravestone doji pattern forming right on the ascending trendline. This gravestone doji pattern is followed by a bearish engulfing pattern. The most important thing that you should take noted of is that both these reversal patterns are appearing on the support line. These two patterns are appearing after a nice uptrend indicating that the uptrend might be coming to a close and a downtrend about to start. You can further confirm this bearish reversal signal on the H4 chart which is showing a bearish engulfing pattern.
It is always a good idea to check whether the higher timeframe is confirming what is appearing on the lower timeframe just to make sure that you are not mistaking a retracement with the start of a new trend. Candlestick patterns on their own can’t be taken as a trading signal. What you need to do is to find confluence with some other indicator before you trade these candlestick patterns. You can read further the GBP/USD triangle formation analysis published on the ForexPros.com.
One leading indicator that combines very well with candlestick patterns is the Divergence. Combining divergence with candlestick patterns and trendline break can be a very good strategy. You can draw a trendline on H1 timeframe and wait for the candlesticks to break that trendline meanwhile check for any regular or hidden divergence. The longer the trendline holds, the more strong it is. In the above GBP/USD Ascending Triangle picture, you can see that the lower trendline held six times which should be considered pretty strong. When the support line is broken on the downside, it is a signal that a downtrend is starting. Similarly when a resistance line is broken on the upside, it is a signal that the uptrend is starting.
Similarly, you can draw a trendline on the H4 timefame as well as on the D1 timeframe. The trendline break on the D1 is considered to be more stronger than the trendline break on the H4 which is considered to be more stronger than the trendline break on the H1 timeframe. However, you should try to filter out false breakouts with true breakouts as it happens most of the time that the breakout turns out to be fake. Only way to filter out false breakouts is to look for divergence before you trade these trendline breaks.